Views: 12691
Last Modified: 27.10.2021
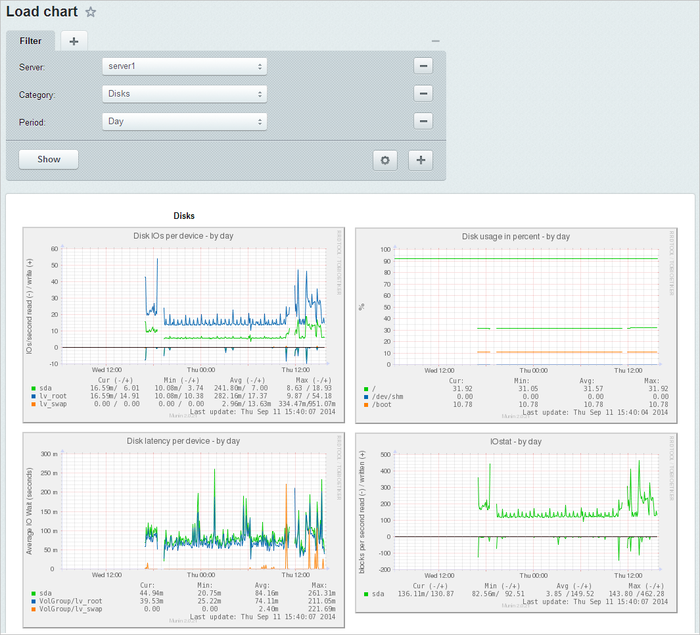
Detailed load charts for various services at each server are displayed at the Load charts page (Settings > Scalability > Load charts). Use filter to select a required server, category and period for chart display:

Such monitoring systems allows printing service diagrams per day, week, month and year for each pool server, using the filter panel:
Apache:
- CPU usage by httpd
- Apache accesses
- Apache processes
- Apache volume
|
MySQL:
- CPU usage by mysqld
- MySQL queries
- MySQL slow queries
- MySQL threads
- MySQL throughtput
|
Nginx:
- CPU usage by nginx
- Nginx status
- Nginx requests
|
Network:
- Connections through firewall
- Firewall Throughtput
- Netstat
- ipconntrack
|
System:
- CPU usage
- File table usage
- Inode table usage
- Load average
- Memory usage
- Swap in/out
- Uptime
|
Disks:
- Disk IOs per device
- Disk latency per device
- Disk usage per persent
- IOstat
- Inode usage per persent
- Throughtput per device
|
Processes:
- Forkrate
- Number of threads
- Processes
- VMstat
|
|
Attention: you need to enable
monitoring in the pool's
Global actions menu to display the load charts.