Last Modified: 08.09.2022
|
|
|
Views: 12828
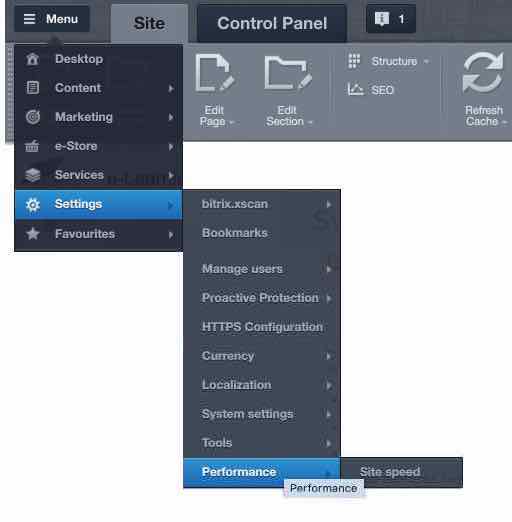
Last Modified: 08.09.2022 To test performance from within the public section, click the button
Performance
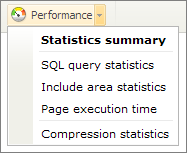
When debugging from Control Panel, you will also see the SQL query statistics, page execution time and compression information. You may choose which information to display by clicking the drop-down arrow of the Performance button.
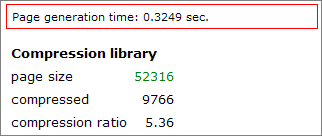
The page generation time, SQL statistics and compression information are displayed at the page bottom:
The Total SQL Queries link opens a detailed report of all the database requests performed while building a page.
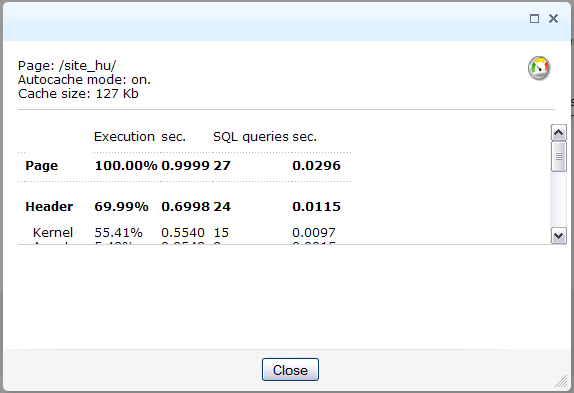
If the options Page execution time and SQL query statistics are both selected, the Page generation time field is a link:
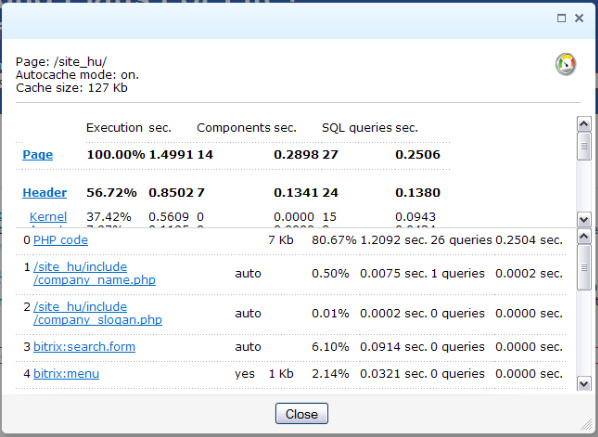
However, if the Statistics summary option is selected, the Page generation time link shows a much more detailed report:
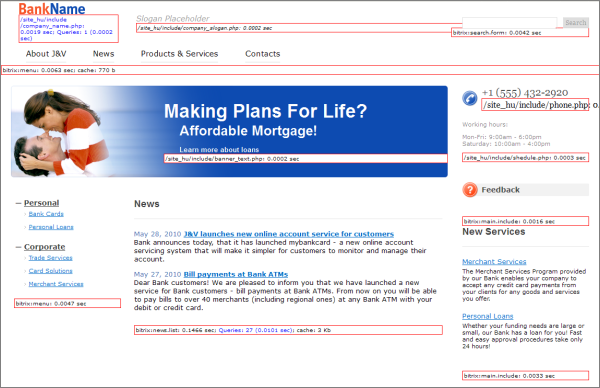
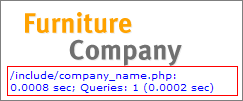
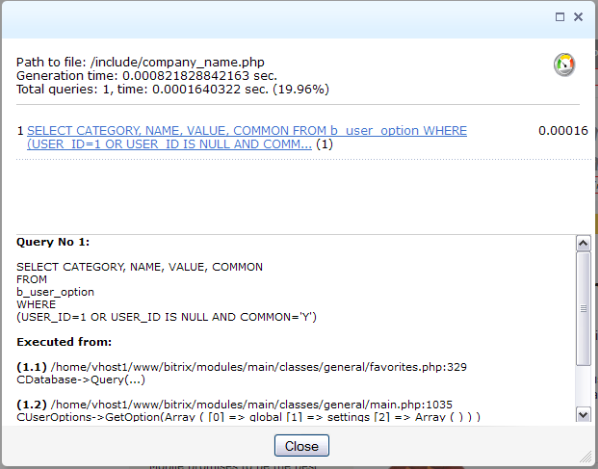
Click the links in the top portion of this form to show the respective information. Use the links in the bottom section to view the request information. The Request InformationTo view information about requests performed by a component, select the Include area statistics menu item and then click a link showing Queries: X, in the statistics area beside the component:
The bottom area of the form displays the request details. Use the links in the upper area to view the details of a required request.
Courses developed by Bitrix24
|
