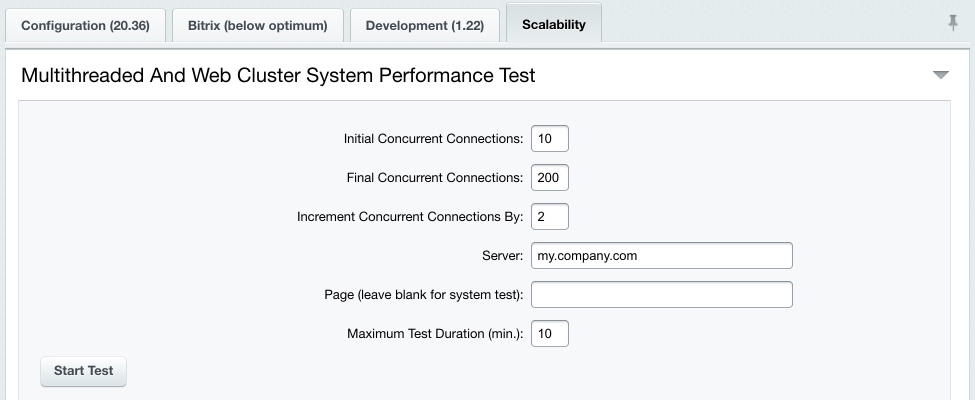
The Performance module has an integrated testing tool for multithread and web cluster systems (Settings > Performance > Performance Panel, Scalability tab).
Open the form to perform the test. Let's clarify some fields.
Server, to be tested. To minimize effects of the testing минимизации влияния самого тестирующего скрипта на результаты тестов рекомендуется запускать его не на тестируемых серверах, а на отдельном хосте.
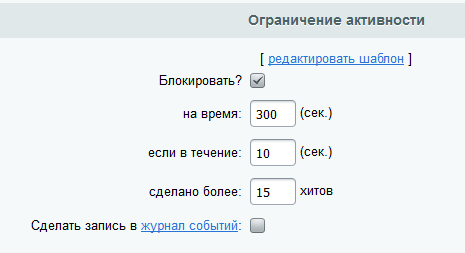
Также на тестируемом сайте необходимо на время проведения теста отключить опцию блокировки пользователя при большом количестве соединений (
Блокировать?
) в настройках модуля Веб-аналитика, закладка Настройки, секция Ограничение активности.
Page (leave blank for system test). This field indicates page address to be queried during test, i. e. to the index page. With empty page, the query will target system page;
Maximum test duration (minutes). Sets test's time upon в течение которого продолжается тест по достижению числа соединений, указанных в поле Final Concurrent Connections field, причем в каждом последующем шаге теста количество одновременных соединений будет одно и то же.
Click Start Test, and the following will be generated in the real time: table with results, Pages per Second and page Generation/Acquisition Time diagrams.
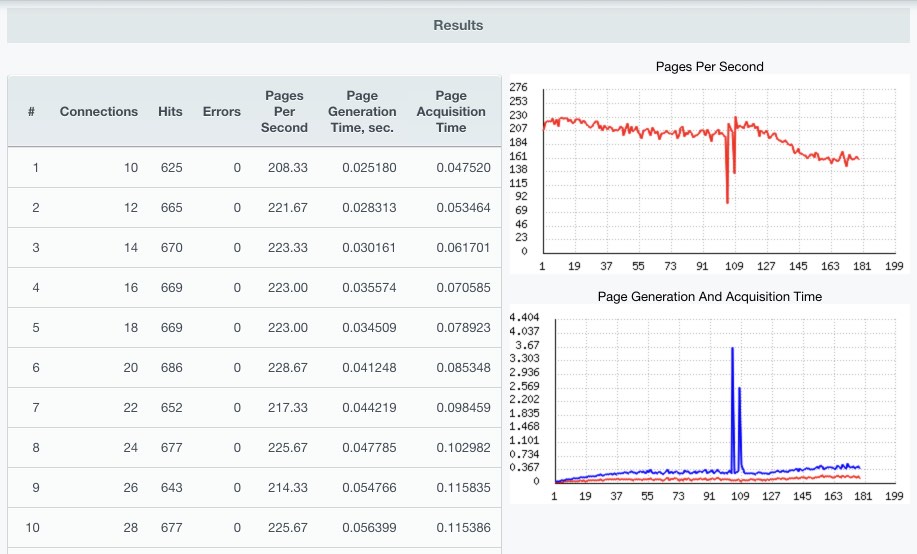
Results table
In addition to the test's columns No. and Connections that are self-explanatory, the table has the following columns:
Hots - general number of hits performed per test;
Errors - in this case, error is the server response, different from 200 ОК;
Pages Per Seconds - number of pages passed by the tested server per second;
Page Generation Time - time for generating a page at the tested server;
Page Acquisition Time - time for acquisition of tested server.
Pages per Seconds diagram
With increased number of simultaneous connections, server must pass higher amount of pages and under normal conditions, the diagram must have a trend to the increase.
In case of increased load, the diagram has a horizontal trend, it means that settings are not optimal or server start to fail in operation.
The diagram shouldn't have significant dropdown trends with the same number of connections.
Page Generation and Page Acquisition Time
With increased number of simultaneous connections, page acquisition time for customers will increase (blue diagram), and page generation time should not change significantly (red diagram).