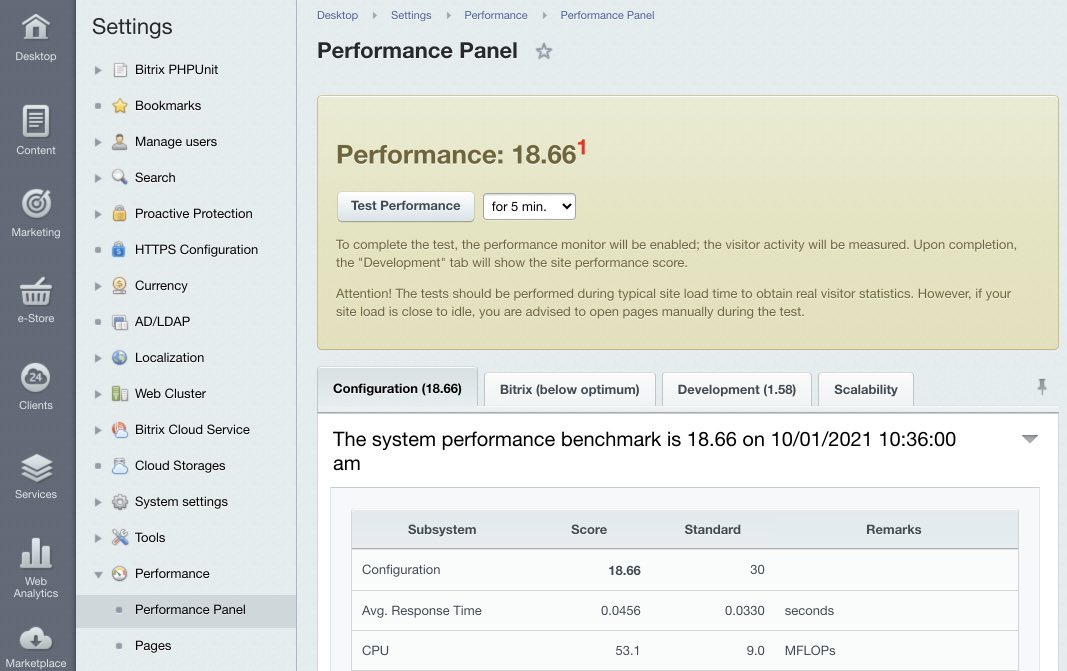
Proceed to Performance monitor section (Settings > Performance > Performance panel) to assess performance effciency.
Clicking on the Test performance button allows detecting bottlenecks in the hosting setup. It's important to remember that numbers in the Configuration tab can be significantly different during server load fluctuations: when load doesn't exist, performance can be high, if load is present - performance can decrease. This is related to the numbers showing the speed needed to open site page and, naturally, depend on the server load.
The issue is not always with the hosting, the load can be caused by the site content itself. The module allows determining the issue and how to fix it. To do it, launch the performance test during a specific time period - for
projects with small number of visitors
When a site has a small number of visitors, it's recommended for you to open various site pages to collect module statistics.
– an hour, as an example. The highly-visited sites can have a smaller time period. The system will register visitations and collect statistics for each page visit time, number of SQL queries and other parameters.
Performance parameter - value, divided by product's core execution time (mean value per 10 measurements).
When
Performance = 18,66
, the public site page with empty template (for example, version for print) and empty work area will be created in 1/18,66 or 0,0536 seconds. In terms of speed, a web server is capable of creating 18 empty pages per second. That is, the higher the number, the higher the site's performance.
By multiplying 18 (pages per second) by 60 we get the result that server can generate approximately 1080 empty pages per minute, but with engaged CPU. This way, if site visitation is approx. 1000 people per day, server performance will be
at full capacity
The scenario in this case is 1000 site visitors in a single moment.
. Naturally, performance in real time will be lower, depending on the "load" of various site pages, server load and other conditions.
Performance value is not calculated based on the file system performance, database, sessions and email operation. Performance value is needed to assist the system administrator in finding a bottleneck (if exist) in the system. Performance value is always reciprocal to the mean response time.
The Most Common Configurations Issues
The result depends on the user functions in /bitrix/php_interface/init.php.
The system connects a specified
fileNote: the init.php file is connected when opening each site page and designed for launching event handlers or connecting any additional functions. File is optional (i. e. it can be missing in the folder /bitrix/php_interface).
for each hit, including when handling Control panel. The file /bitrix/php_interface/init.php should not contain database queries and any other resource-consuming operations.
Performance score will fluctuate depending on the load.
The higher the server load, the lower the score. However, even at the peak load, it should not decrease lower than the acceptable level to indicate that server manages to successfully handle the load (for example, not lower than 10 points, or 0,1 sec. per page).
Performance value doesn't show the capacity for system scalability.
Web server process is single-cored, using only a single CPU. Measuring the performance without a real-world load does not affect the score. Similarly, a multicore web server can withstand heavy loads without significant performance degradation.
Performance rating for a database, located at a dedicated server will be lower.
When cluster is involved, we have a scalable system: upon increasing load it must maintain good parameters. In case of no load, when momentarily measuring opened pages, we will inevitably see a small slowdown resulting from inter-server communications.