Views: 2958
Last Modified: 27.07.2022
The Diagrams page (Services > Helpdesk > Diagrams) can build a report as chart or diagram based on the following parameters:
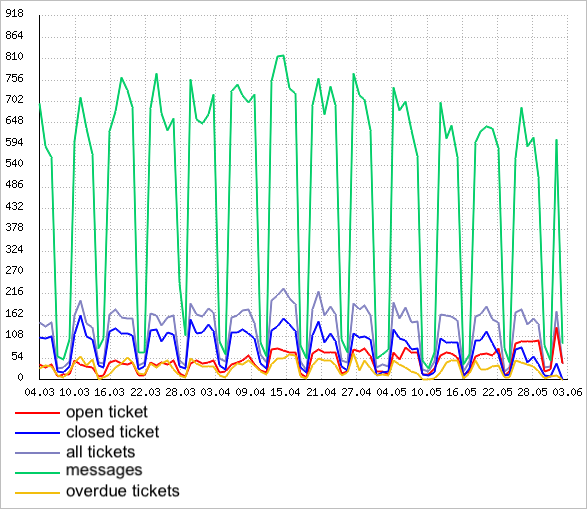
- techsupport/helpdesk load. Diagram shows the number of queries and messages in the helpdesk system by days. Diagram shows the tech support load on a specific date and can be used for executing management decisions for techsupport/helpdesk service:
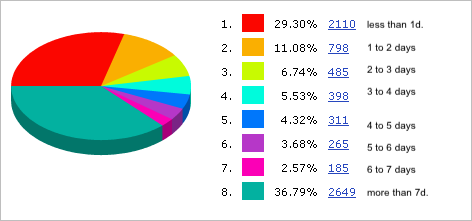
- by duration of issue resolution. The pie chart shows a standard amount of time (in days) that is expended for resolving issues by technical support:
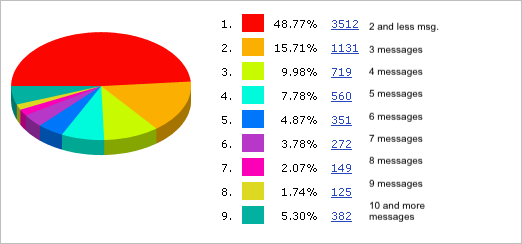
- by number of messages, required for resolving an issue. This diagram presents a percentage ratios for number of messages in closed tickets: