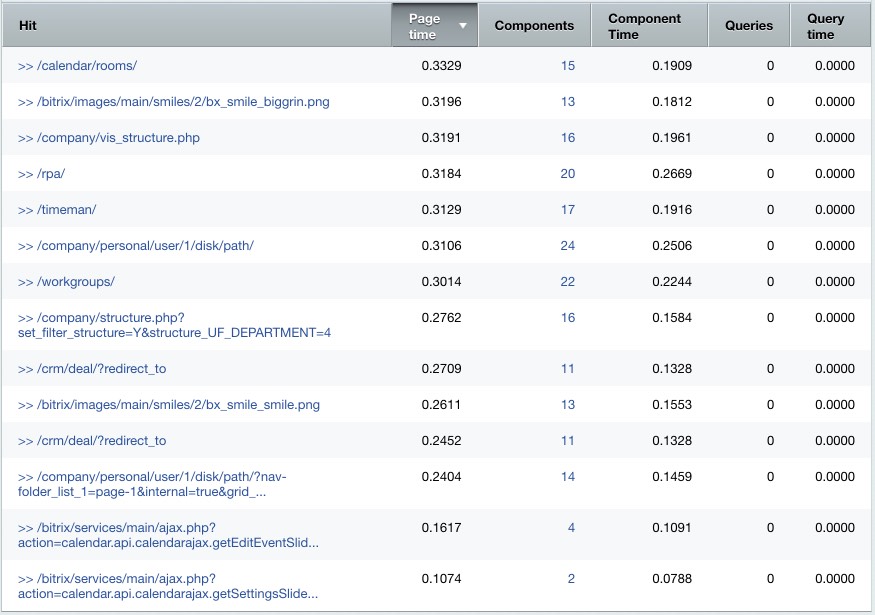
Performance monitor: hits page (Settings > Performance > Hits) shows the report on
hitsHit - is is a request to a web server for a file (such as a web page, image, JavaScript, and etc.).
Open >> to jump to a desired public page and view
detailed statistics
.
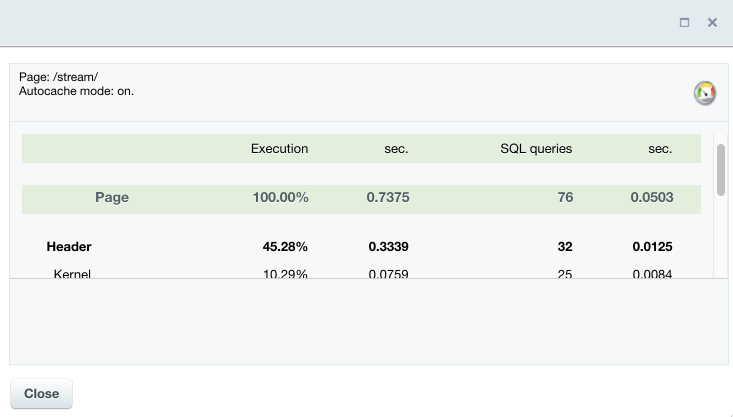
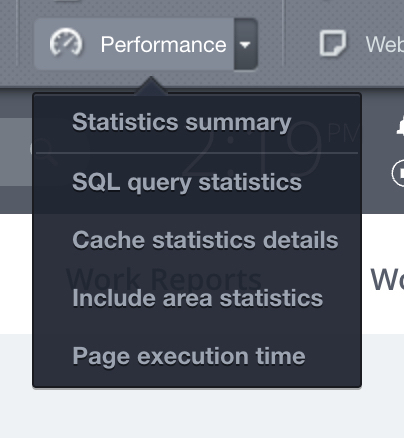
Note: Clicking on
Performance
or selecting Statistics Summary (Performance > Statistics summary) at the Control Panel in the site's public section and following the link >> from the Performance monitor: hits page (Settings > Performance > Hits) allows viewing
more detailed statistics
.
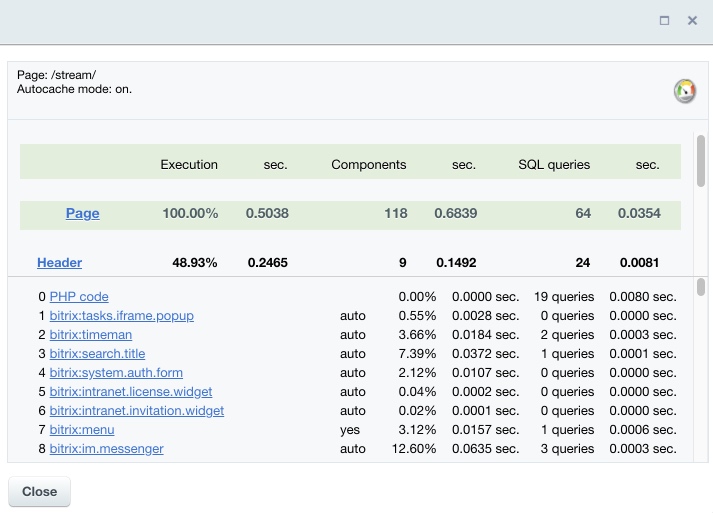
Clicking the link with page name (or via the link in the Queries section) allows viewing all the hit's SQL queries at the SQL Queries page.
Using the link in the Components column allows viewing report for components used at the Components page.