To access Performance Monitor global settings, browse to Settings > System Settings > Module Settings > Performance Monitor.
The module settings have the following options:
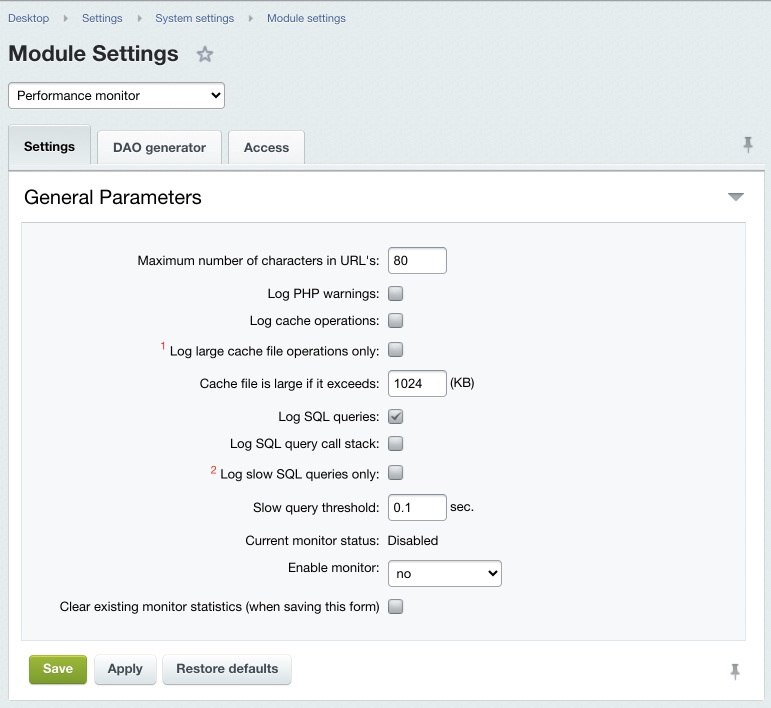
Maximum number of characters in URLs - this option allows indicating maximum number of characters to be used for displaying URLs at the admin pages related to module.
Log PHP warnings - registers PHP errors, shows errors at the
PHP errors page
You can view PHP errors log at the Performance monitor page: PHP errors log ((Settings > Performance > PHP errors (N)), where N - general number of errors.
Log cache operations - registers cache files information, data views - at the
CachingCaching page (Settings > Performance > Caching) where you can view information about cache and its files.
Log large cache file operations only - saves operations only with cache files with size larger than indicated in the field Cache file is large if it exceeds.
Log SQL queries - registers SQL queries, enables viewing of entries at the
SQL Queries page
You can browse SQL queries at the Performance monitor page (Settings > Performance > SQL Queries):
Log SQL query call stack - saves a query stack, viewed at the SQL Queries page.
Log slow SQL queries only: - writes queries with duration longer than indicated in the field Slow query threshold.
Enable monitor - launches performance monitor in a selected time. This action is similar to option Test performance at the Performance Panel page (Settings > Performance > Performance Panel).
If monitor is enabled, then the field Current monitor status will show status Up and running, with the following information displayed below: Active till: (hours:minutes:seconds).