Last Modified: 11.10.2021
|
|
|
Views: 3779
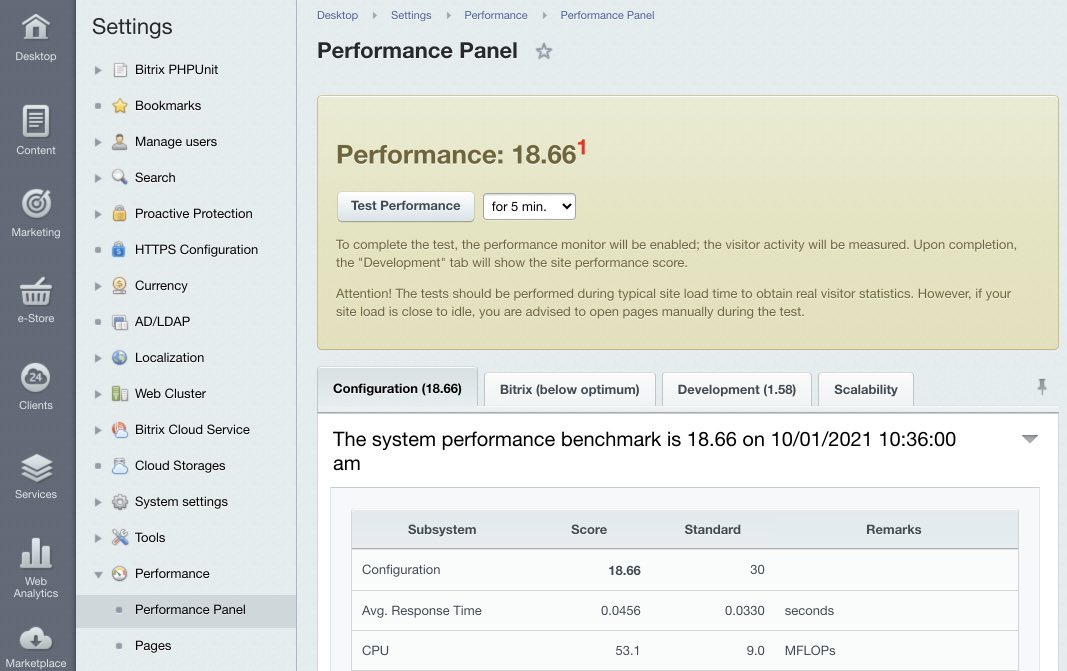
Last Modified: 11.10.2021 Searching for site bottlenecksProceed to Performance monitor section (Settings > Performance > Performance panel) to assess performance effciency.
Clicking on the Test performance button allows detecting bottlenecks in the hosting setup. It's important to remember that numbers in the Configuration tab can be significantly different during server load fluctuations: when load doesn't exist, performance can be high, if load is present - performance can decrease. This is related to the numbers showing the speed needed to open site page and, naturally, depend on the server load. The issue is not always with the hosting, the load can be caused by the site content itself. The module allows determining the issue and how to fix it. To do it, launch the performance test during a specific time period - for projects with small number of visitors When a site has a small number of visitors, it's recommended for you to open various site pages to collect module statistics. – an hour, as an example. The highly-visited sites can have a smaller time period. The system will register visitations and collect statistics for each page visit time, number of SQL queries and other parameters. Performance parameter - value, divided by product's core execution time (mean value per 10 measurements).
When
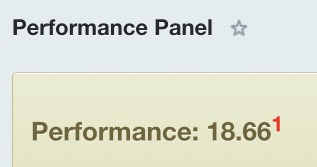
Performance = 18,66
By multiplying 18 (pages per second) by 60 we get the result that server can generate approximately 1080 empty pages per minute, but with engaged CPU. This way, if site visitation is approx. 1000 people per day, server performance will be at full capacity The scenario in this case is 1000 site visitors in a single moment. . Naturally, performance in real time will be lower, depending on the "load" of various site pages, server load and other conditions. Performance value is not calculated based on the file system performance, database, sessions and email operation. Performance value is needed to assist the system administrator in finding a bottleneck (if exist) in the system. Performance value is always reciprocal to the mean response time. The Most Common Configurations Issues
Courses developed by Bitrix24
|

