Views: 17317
Last Modified: 21.09.2017
The following steps are required to initiate operation of monitoring system:
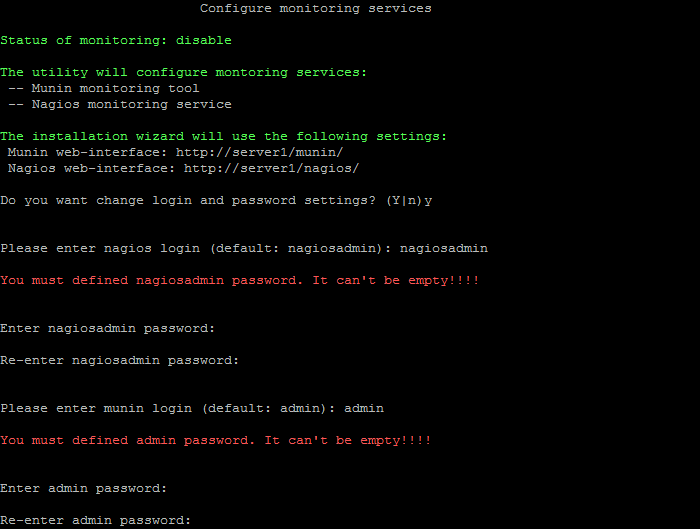
- Select the item in virtual appliance the item 9. Monitoring in pool > 1. Configure monitoring services:

- Then, the wizard will offer to change the login and password for server Nagios and Munin monitoring services:

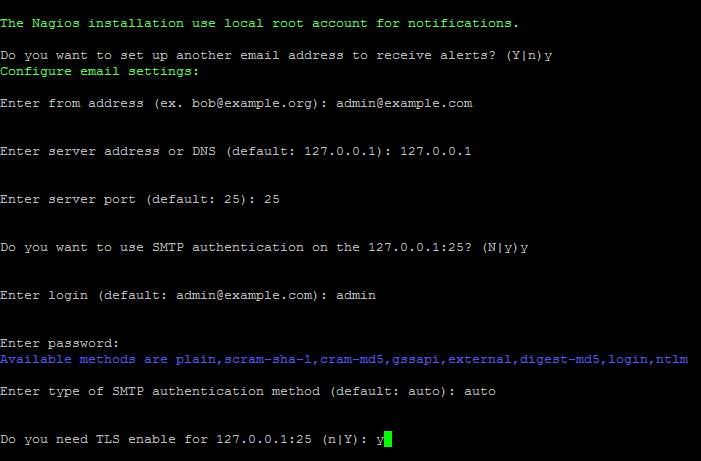
- The system will offer to indicate the e-mail for Nagios system notifications (root user e-mail is used by default) and e-mail server data for e-mailing:

- from address - sender's address for e-mail forwarding. In this case, this e-mail will be used also as the recipient of notifications from Nagios.
- server address or DNS - IP- or DNS- e-mail server address. By default address will be used (127.0.0.1), if Enter is pressed
- server port - server port. The port depends on the connection type, 25 - for simple and 465 - for encoded (with the use of SSL). By default port (25) will be used if Enter is pressed.
- If SMTP-authorization is required, then input
y in the line SMTP authentication and enter login and password for access to SMTP-server; otherwise - input n.
- If SMTP-authorization option is selected, then it will be necessary to input type of authentication method authorization type:
auto, plain, scrum-sha-1, scrum-md5, gssapi, external, digest-md5, login, ntlm.
- If TLS-protocol for protected data transfer is required, then input
y in the TLS enabled line, otherwise - input n.
- After that, the wizard will configure the required settings and will launch server monitoring services.
Attention! Task execution may take a rather long time (up to 2-3 hours and more) depending on the task complexity, data volume used in such tasks, capacity and server load. You can check the currently executed tasks by using menu item 5. Background tasks in the pool > 1. View running tasks. If task completion log files are needed to be reviewed, they are located in the following directory /opt/webdir/temp.
Monitoring
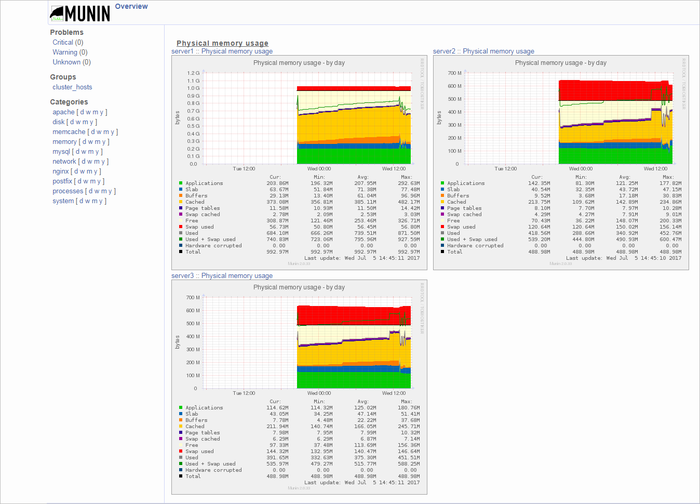
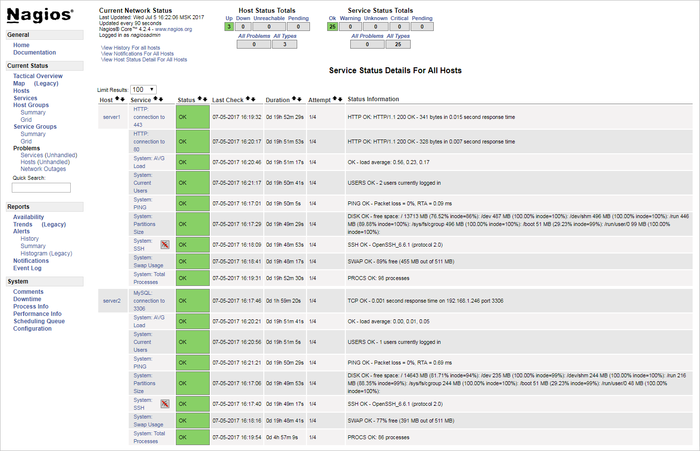
For server monitoring from the browser, go to addresses and login into monitoring accounts:
- Munin - http://server_adress/munin/:

- Nagios - http://server_adress/nagios/:

Note: Change of passwords for monitoring systems is possible with the repeated launch of the menu 9. Monitoring in pool > 1. Configure monitoring services.
How to check e-mail notifications from Nagios
It is easy to check how notifications operate:
- For example, stop the MySQL service:
CentOS 6:
service mysqld stop
CentOS 7:
systemctl stop mysqld.service
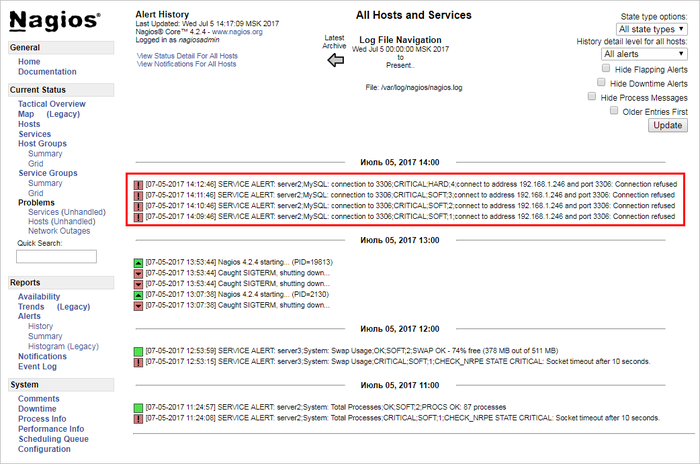
By default, Nagios will record into the log 3 messages with the CRITICAL;SOFT status each minute, and, at the 4th message, the service will show status CRITICAL;HARD:

As a result, the message with approximately the same content could be sent to the e-mail, indicated in the para. 3 of admin notification settings (from address field):
Subject: ** PROBLEM Service Alert: server2/MySQL: connection to 3306 is CRITICAL **

***** Nagios *****

Notification Type: PROBLEM

Service: MySQL: connection to 3306
Host: server2
Address: 192.168.1.246
State: CRITICAL

Date/Time: Wed Jul 5 14:12:46 MSK 2017

Additional Info:

connect to address 192.168.1.246 and port 3306: Connection refused
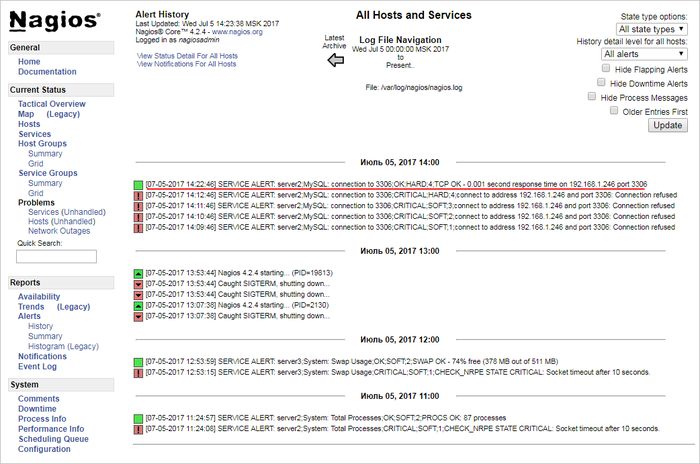
After the launch of MySQL service with # service mysqld start command (CentOS 6) or with # systemctl start mysqld.service (CentOS 7), the record with OK;HARD status will appear in the Nagios log:

And the message should arrive to e-mail:
Subject: ** RECOVERY Service Alert: server2/MySQL: connection to 3306 is OK **

***** Nagios *****

Notification Type: RECOVERY

Service: MySQL: connection to 3306
Host: server2
Address: 192.168.1.246
State: OK

Date/Time: Wed Jul 5 14:22:46 MSK 2017

Additional Info:

TCP OK - 0.001 second response time on 192.168.1.246 port 3306
- As we can see, everything is operational - in case of malfunctions on any server, Nagios will send a notification to the admin's e-mail with indication of a problem.

